Study Overview
Advanced Imaging Solutions with Both Operetta CLS and Opera Phenix Plus
ACEL provides comprehensive High-Content Analysis (HCA) and High-Content Screening (HCS) services using both the Revvity Operetta CLS™ and Opera Phenix™ Plus High-Content Screening Systems.
A High-content Screening System is an advanced, fully automated microscope system designed to rapidly capture and analyze highly detailed images of complex biological samples, like live cells and 3D organoids.
Previously, analysis of fluorescent images could only be performed qualitatively, leading to ambiguity and subjectivity.
With High-content screening systems, it’s possible to simultaneously take high-resolution, multi-color images of thousands of samples without sacrificing speed or sensitivity.
By having two complementary high-content imaging platforms, we are able to select the most suitable system for each project based on assay complexity, throughput requirements, image quality, and experimental objectives.
This flexibility allows us to support a broad range of applications, from routine cell-based assays to highly sophisticated phenotypic screening and 3D cell culture analysis.
Using intelligent image analysis algorithms, large amounts of data can be easily and rapidly analysed.
This throughput allows for rapid compound screening during the drug discovery phase.
We own both Revvity’s Operetta CLS and Opera Phenix Plus.
Interested to find out more about the systems? Contact us for more details.
Equipment used
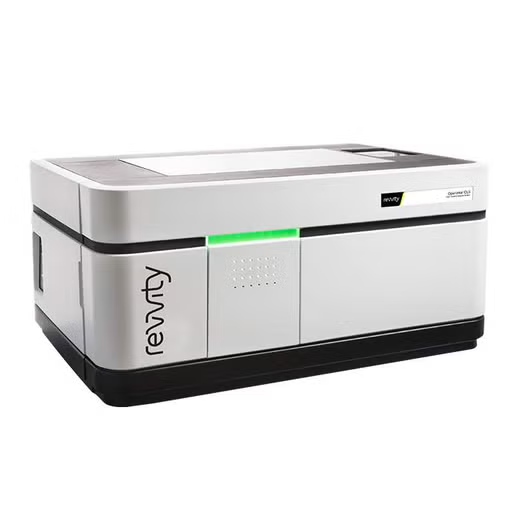
Operetta CLS (Revvity)
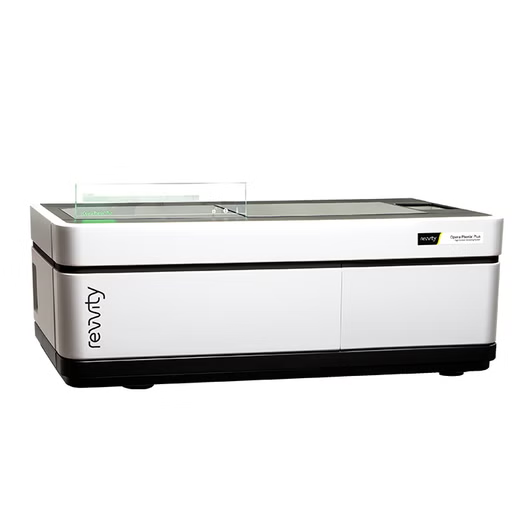
Opera Phenix Plus (Revvity)
Image analysis application examples
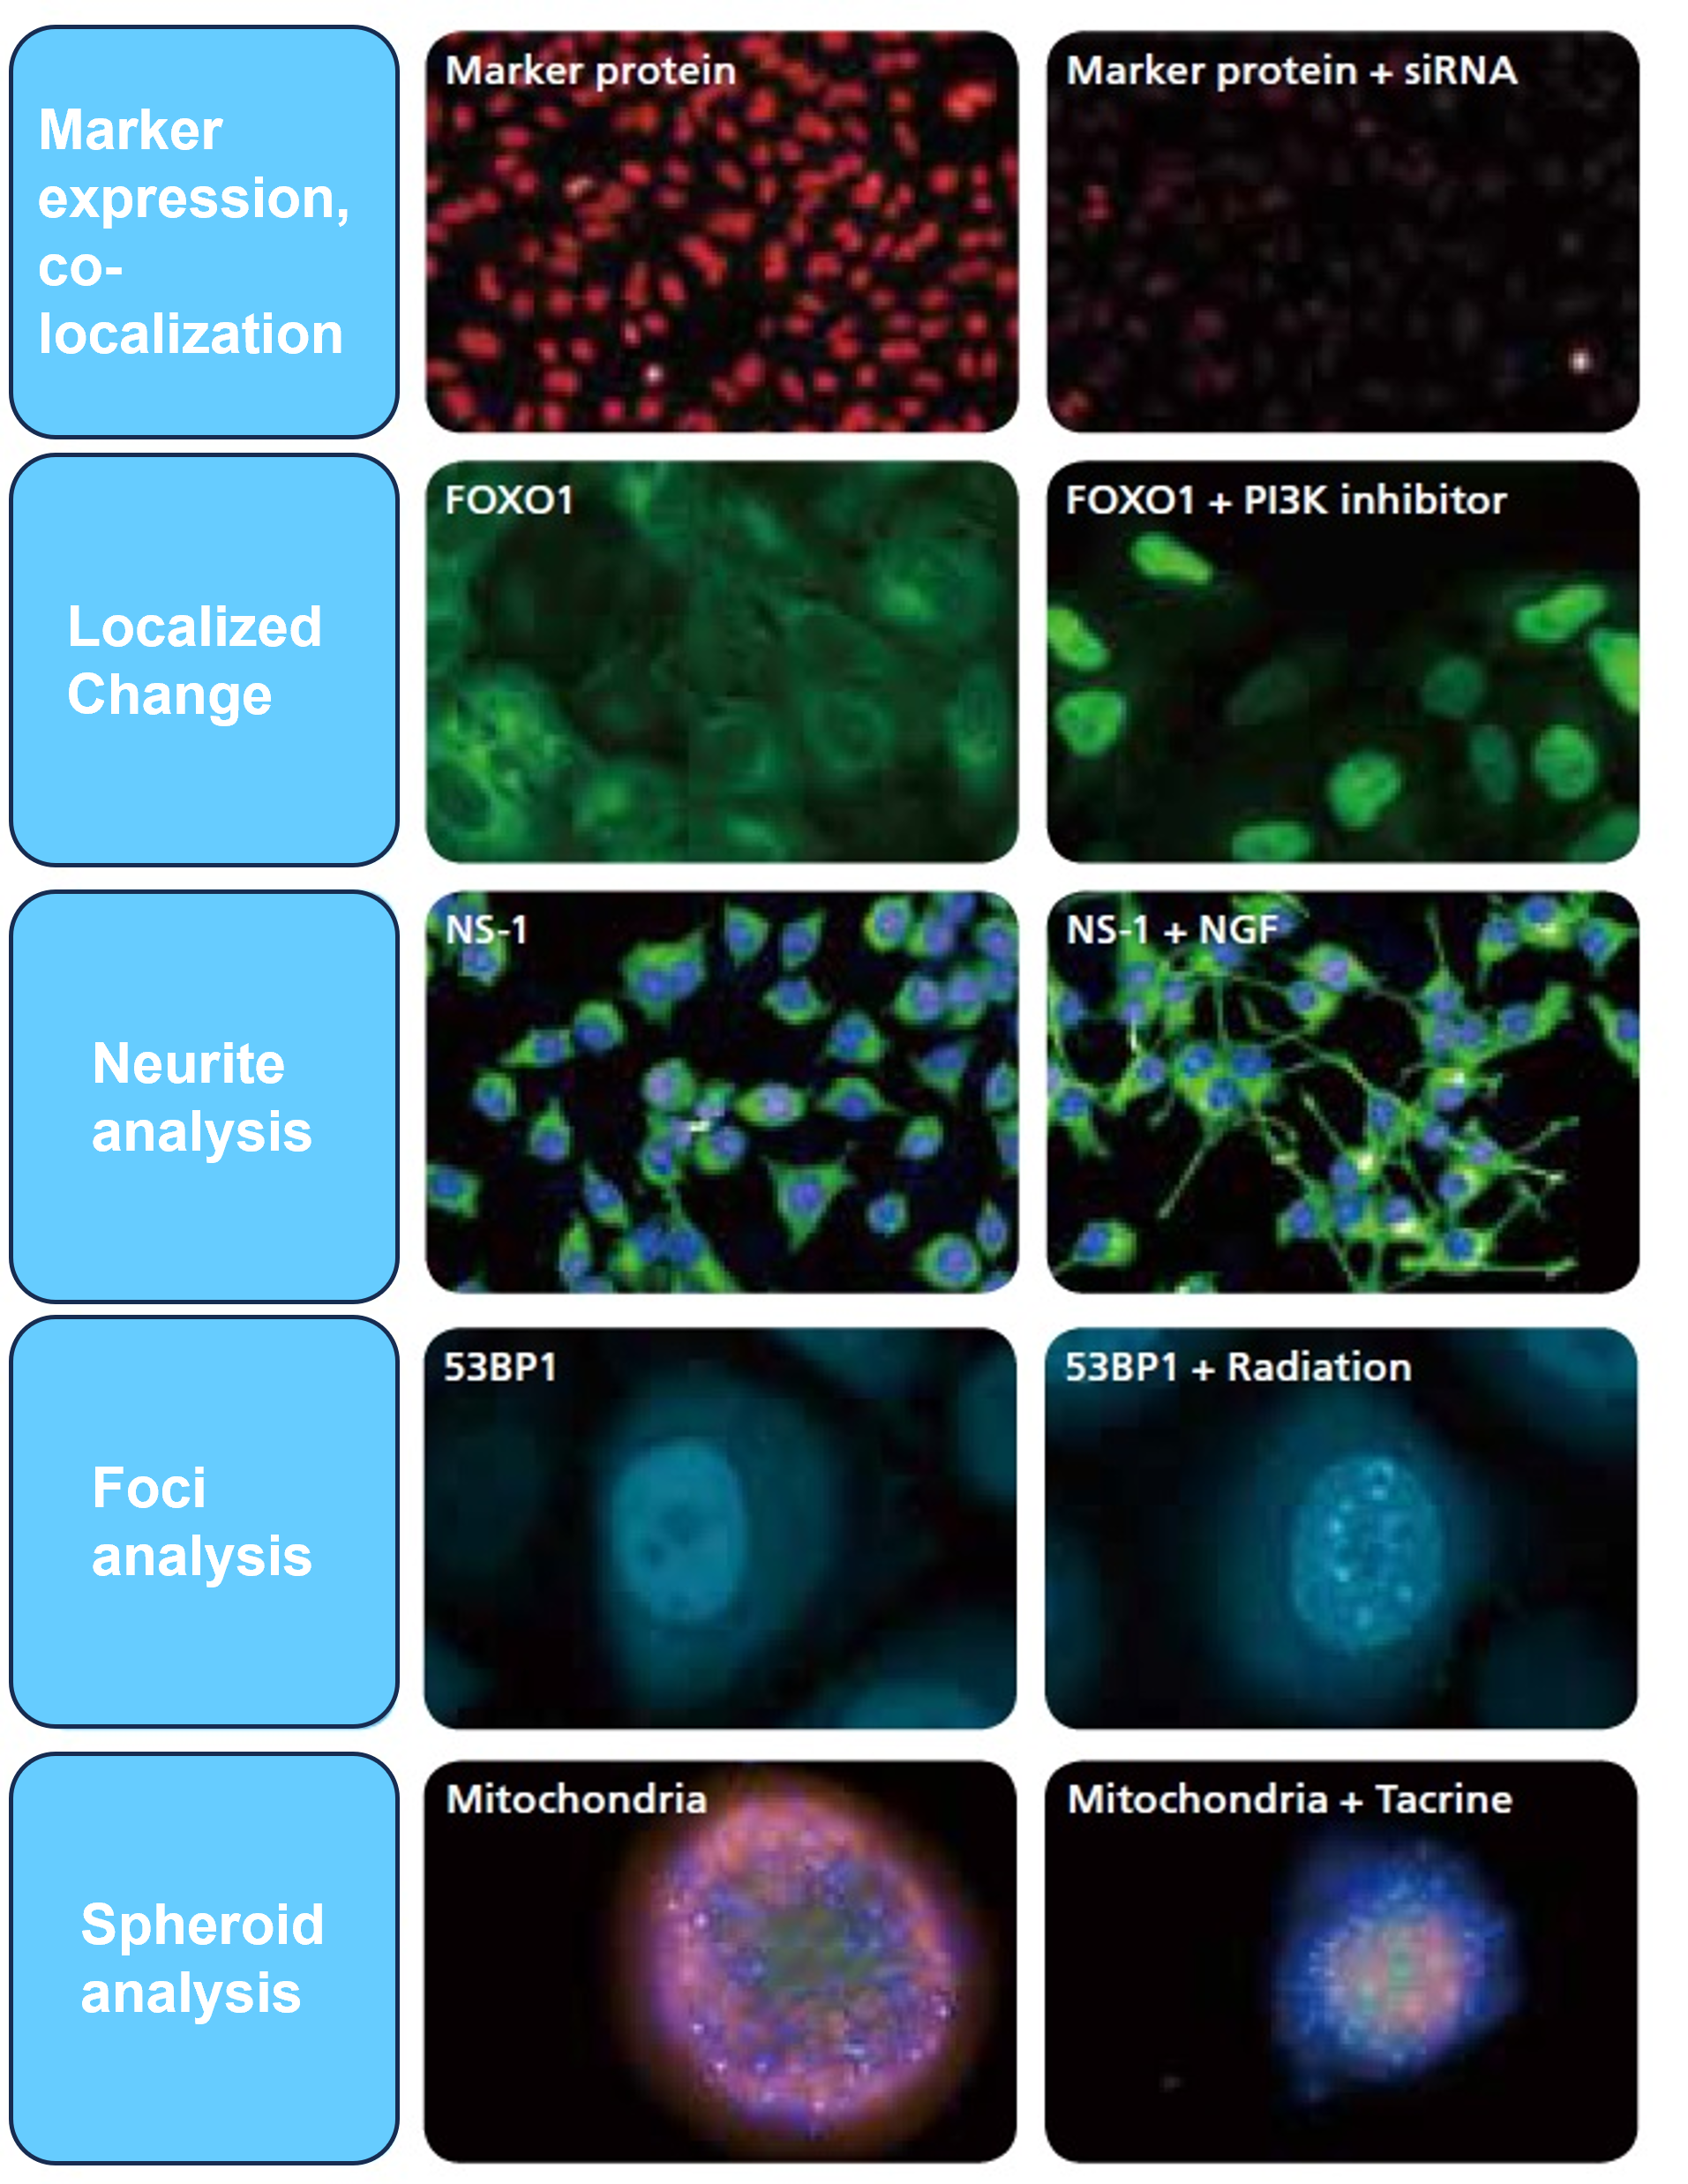
There are many applications of the system, as seen in the examples above.
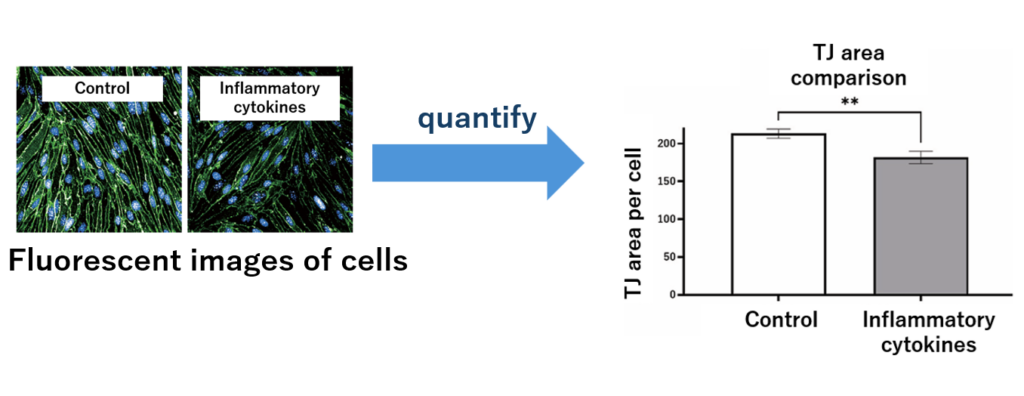
Accurate cell recognition
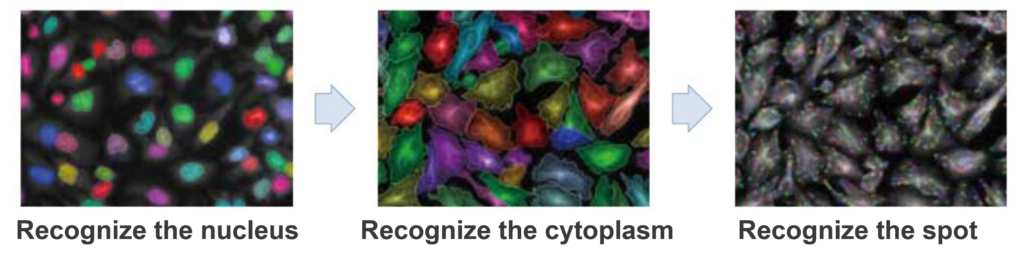
The accurate detection and segmentation of the nucleus, cytoplasm and intracellular spots is a routine analysis feature of High Content Analysis.
Myotubular differentiation
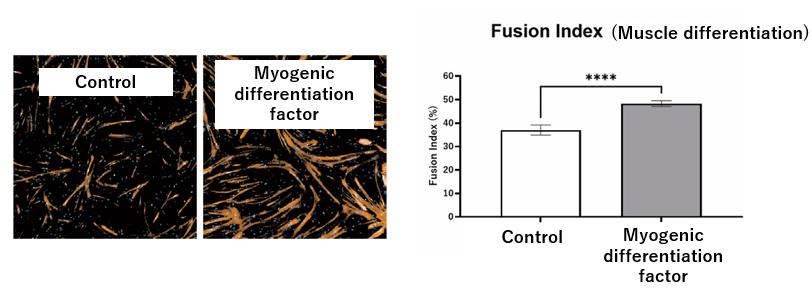
This study harnessed the power of High Content Imaging to automatically characterize and quantify muscle differentiation using the Operetta system.
The cells were either untreated (Control) or treated with myogenic differentiation factor (MDF) on muscle cells.
A significant increase in fusion index in cells treated with MDF, indicative of muscle differentiation, was demonstrated through the fluorescence imaging and quantification.
Neurite outgrowth
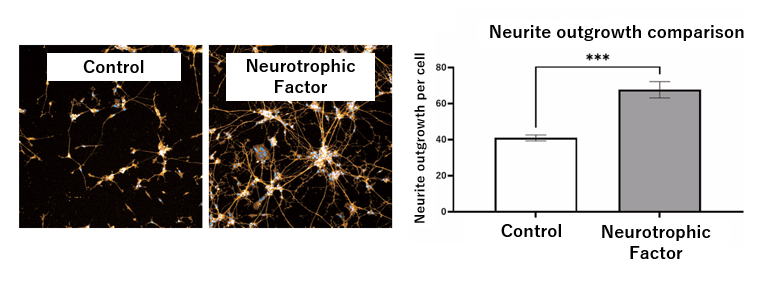
This study also applied the High Content Imaging system to quantify the amount of neurite outgrowth when a neurotrophic factor was applied to neural cell culture compared to a control condition (untreated).
Significant increases in neurite outgrowth per cell were detected after quantification and also visible in the fluorescence images on the left.
These studies showcase the application of High Content Imaging for rapid quantification and screening of test substances.
Others
Tests can also be performed using siRNA-based gene knockdown studies and forced gene expression tests.
For suspension cells, analysis using a flow cytometer is more effective.
References
●Growth Rate inhibition metrics correct for confounders in measuring sensitivity to cancer drug
Hafner et al., Nature Method, 2016
●A high-content image-based method for quantitatively studying context-dependent cell population dynamics
Garvey et al., Scientific Reports, 2016
●Anticancer drug released from near IR-activated prodrug overcomes spatiotemporal limits of singlet oxgen
Rajaputra et al., Bioorganic & Med. Chem., 2016
●A Comprehensive Analysis of the Dynamic Response to Aphidicolin-Mediated Replication Stress Uncovers Targets fot ATM and ATMIN
Mazouzi et al., Cell Rep., 2016
●PPIP5K1 Suppresses Etoposide-triggered Apoptosis
Machkalyan et al., J. Molecular Signaling, 2016
*All our studies are mainly performed and handled by our team of PhD scientists.